
Your watch hands you a number most mornings. Heart rate variability, it says, then a value in milliseconds, then, on a good day, a small green note telling you that you are recovered. On a worse day it says something quieter, and you spend the walk to the kitchen wondering what you did.
It is a strangely intimate metric. Most of the numbers our bodies produce are loud: a pulse you can feel, a weight you can read. Heart rate variability is silent, invisible, and almost impossibly small, and yet it is one of the more honest windows we have into how your body is actually doing.
It also invites one of the least useful habits in health tracking: comparison. You see your number, you hear your friend's, and within seconds you have decided whose body is winning. This is a piece about why that comparison rarely means what you think, and what to watch instead.
The space between two heartbeats
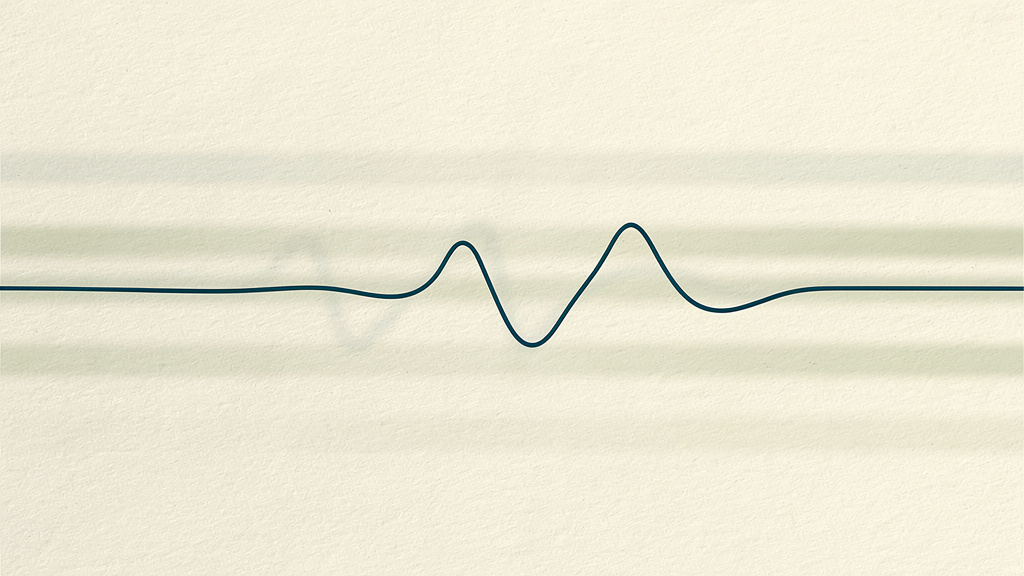
Your heart does not beat like a metronome. Even when your pulse holds steady, the gap between any two beats is not identical. Heart rate variability is the measure of that fluctuation: the variation, in milliseconds, between one heartbeat and the next.
That small flicker is a readout of your autonomic nervous system, the part of you that runs in the background without asking permission. It has two branches in constant, quiet negotiation. The parasympathetic branch, often called rest and digest and carried largely by the vagus nerve, slows you down and lets you recover. The sympathetic branch, the fight or flight side, speeds you up to act. A well recovered body lets the two trade off freely, and that flexibility shows up as more variability between beats. A body under strain locks into a steadier, more rigid rhythm, and variability falls.
The figure most wearables report is called RMSSD, and it mainly reflects that parasympathetic, recovery side. On a ring, a band, or a watch, RMSSD is very likely the number underneath the friendly label.
Heart rate variability is the tiny variation in time between consecutive heartbeats, and it reflects how flexibly your nervous system shifts between stress and recovery.
A signal worth watching
Why pay attention to something so small? Because across large populations, this little number tracks with meaningful things. On average, lower heart rate variability is associated with higher all-cause and cardiac mortality. A 2022 meta-analysis in Neuroscience and Biobehavioral Reviews pooled thirty-two studies and more than thirty-eight thousand participants and found that the lowest band of HRV carried a higher risk than the rest, across ages, sexes, and populations. The older Framingham Heart Study reported a similar pattern decades ago.
Be careful about what that means. HRV is a nonspecific indicator, not a diagnosis. A lower reading is a general sign that the system is under more load, much like a consistently elevated resting heart rate. It points toward a conversation, not a conclusion. A single morning figure is not a verdict. What the research supports is gentler: this is a number worth watching over time, because the direction it moves tends to mean something.

Why your number and your friend's tell different stories
Here is where comparison falls apart. The spread between two healthy people the same age is enormous. It is entirely normal for two equally well adults to differ by thirty or forty milliseconds, for reasons that have nothing to do with who is healthier: genetics, body size, breathing, and baseline physiology all feed the number. A fit fifty year old can easily post a higher HRV than a sedentary thirty year old.
The device matters too. Different wearables use different sensors and different math, so the same body can read one value on a ring and another on a watch, and overnight readings run higher than ones taken sitting up in the morning. When your number and your friend's do not match, the gap is usually telling you about two different bodies measured two different ways. Their number is theirs. Yours is yours.
The average is a floor, not a finish line
You can find charts of average HRV by age, and they do show a real trend: variability tends to drift downward as we get older, often somewhere around one to three percent a year after the mid twenties in wearable data. It is tempting to find your age on that chart, see where you land, and treat the line as a target to beat.
That is the wrong way to read it. A population average describes the broad middle of a crowd. It does not tell you what is possible for you, and it was never built to be a goal. The honest use of that chart is as a floor, a rough sense of the territory, not a finish line. The more interesting question is not whether you beat the line for your age. It is whether your own number, measured the same way over months, is holding or climbing. The average is the crowd. The trend is you.

What actually moves it
The encouraging part is that HRV is not fixed. Of everything that influences it, aerobic fitness appears to be the single biggest lever you actually control. As a broad pattern, active adults tend to hold RMSSD roughly ten to twenty percent higher than sedentary peers of the same age, and trained endurance athletes often run higher still. That is an association seen across groups, not a prescription, and the point is the direction: bodies that move regularly tend to recover more flexibly.
The rest of the list is familiar, because it is the same short list that governs most of how you feel. Sleep, alcohol, hydration, psychological stress, and how hard you have been training all push the number around. A late night, a few drinks, a stressful week, or a heavy training block will usually pull it down for a while. Steady sleep, lighter loads, and real recovery tend to bring it back. None of this is exotic. It is the ordinary work of taking care of yourself, read back to you as a single number.
Reading the trend, not the day
All of which points to the one habit that makes HRV useful: read the trend, not the day. Day-to-day swings of ten to thirty percent are completely normal, driven by all the inputs above. A number that keeps sliding over several weeks is the part that carries information. One low morning is noise. A multi-week decline is a signal.
So stop chasing a single figure and start watching its shape. Use the same device under the same conditions, and watch where the line is heading rather than where it sits on any given Tuesday. If the trend falls and stays low for a stretch, that is not cause for alarm, but it is a fair reason to look closer at your sleep, your stress, and your training, and to raise it with a physician if it persists. The number is most honest when you let it accumulate.
This is how we prefer to read a signal like this: as a trend over time, set beside the rest of your picture, with a physician to put it in context. One data point is noise. A baseline, watched honestly over months, is a story. The number on your wrist this morning is not a grade, and not a contest with your friend. It is one quiet line in a longer conversation your body is having with you. The only comparison that has ever really mattered is the one between you and your own steadily rising baseline.
Common questions
What is a good HRV?
There is no single good HRV that applies to everyone. Values vary widely between healthy people of the same age, and different wearables report different numbers, so a figure that looks high for one person can be ordinary for another. A more useful question than what is good is whether your own number, measured the same way over time, is holding steady or trending up.
Why is my HRV lower than my friend's?
Because you are two different bodies measured two different ways. It is entirely normal for two healthy adults the same age to differ by thirty or forty milliseconds for reasons unrelated to health, including genetics, body size, and breathing. Devices also differ in sensors and math, and overnight readings run higher than seated morning ones. Comparing your number to a friend's rarely tells you who is healthier.
Does HRV decline with age?
On average, yes. In wearable data, HRV tends to drift downward by roughly one to three percent a year after the mid twenties. But individual variation at every age is large, and a fit older adult can have higher HRV than a sedentary younger one, so the population average by age is a reference point rather than a target.
How can I improve my HRV?
The single biggest modifiable influence appears to be aerobic fitness: active adults tend to hold RMSSD higher than sedentary peers of the same age. Sleep, alcohol, hydration, stress, and training load also move the number day to day. These are general lifestyle patterns rather than a prescription, and the goal is a gradually rising personal trend, not a single high reading.
Is a low HRV reading something to worry about?
A single low reading is usually just normal day-to-day variation and not a cause for alarm. HRV is a nonspecific signal, not a diagnosis. What is worth noticing is a sustained decline over several weeks, which is a reasonable reason to look at your sleep, stress, and training, and to raise it with a physician if it persists.