

A lab report arrives with a column of numbers, and next to every number, a smaller pair of numbers in parentheses. That second pair carries more quiet authority than almost anything else in medicine. It is the reference range, and it decides whether a result prints in black or gets flagged in red. Most people read it as a verdict: inside the line means fine, outside means a problem. The line itself is worth a closer look, because it was never drawn around any single person. It was drawn around a crowd.
What a reference range actually is
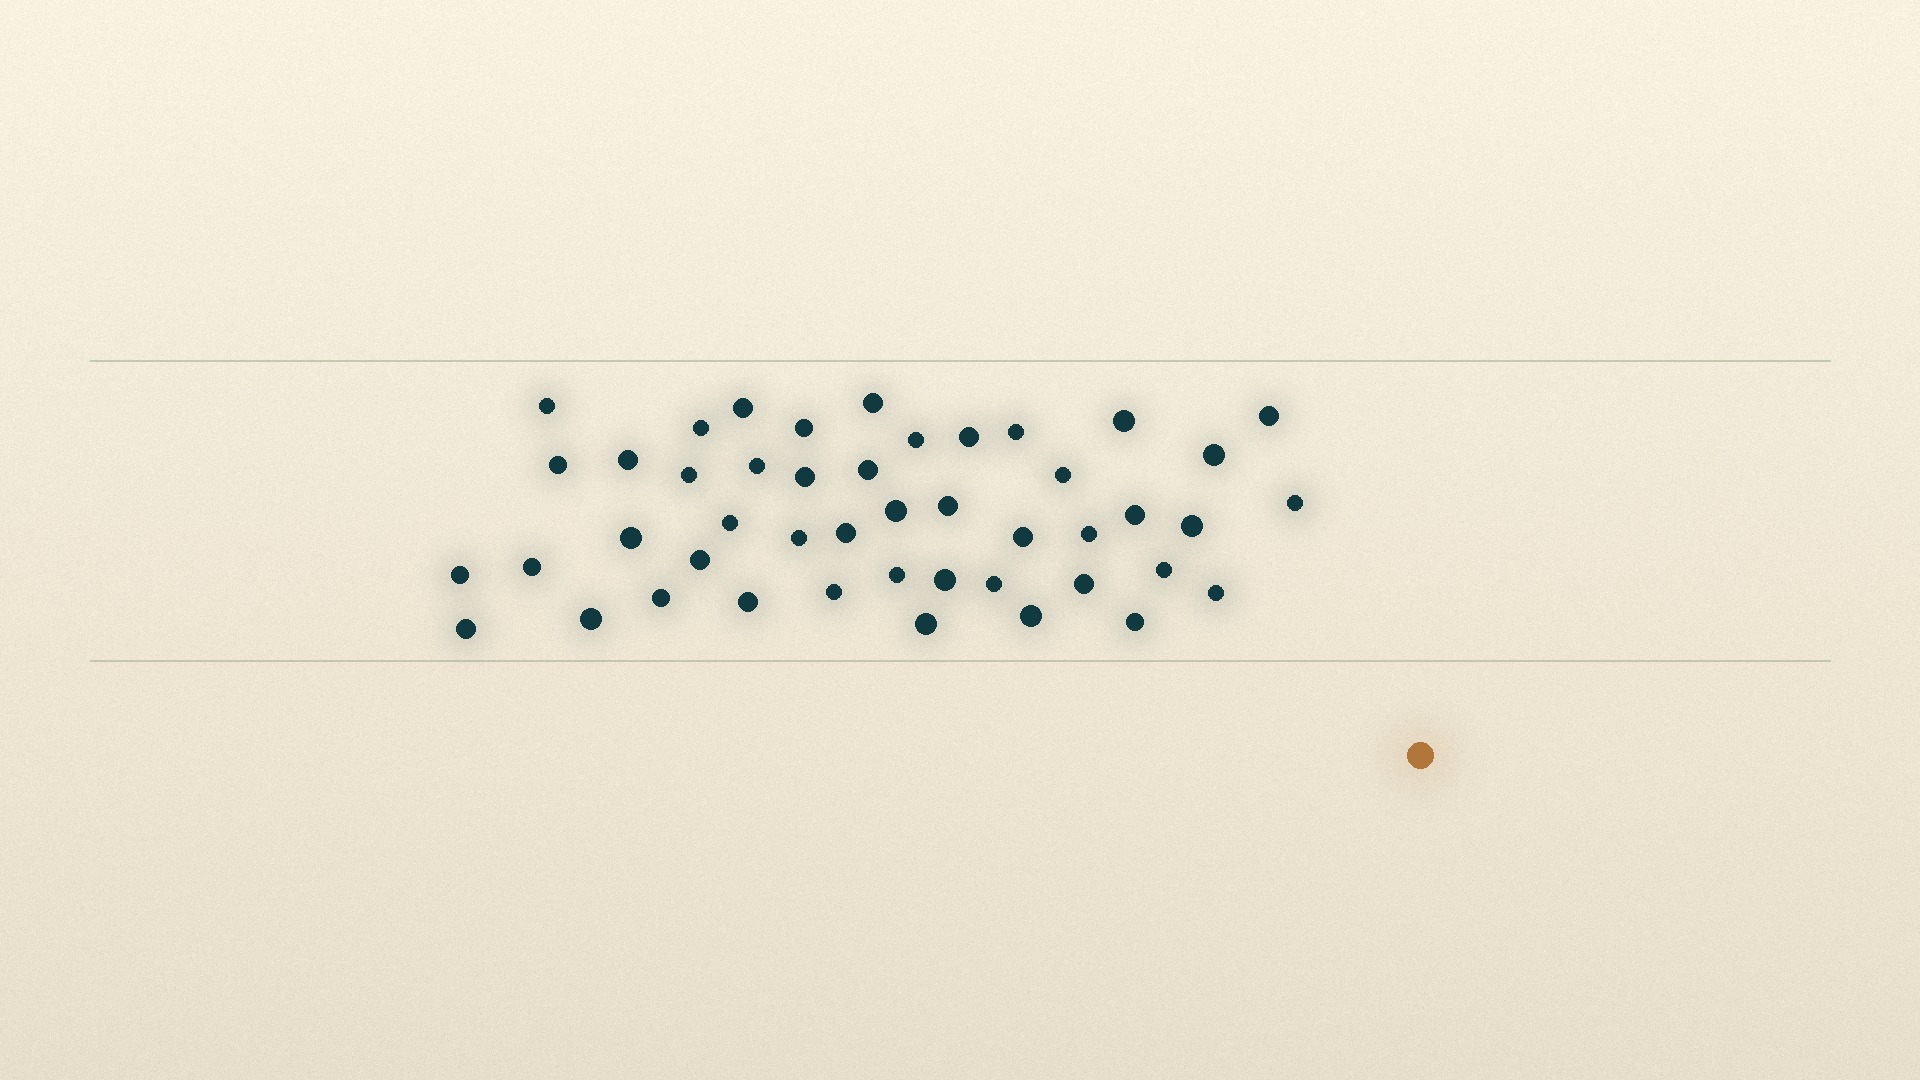
A reference range is not a medical judgment about your body. It is a statistical description of a group. To build one, a laboratory recruits a panel of people screened to be free of the condition the test is meant to detect, draws their blood under standardized conditions, and lines up every result from lowest to highest. Researchers then identify the 2.5th and 97.5th percentile of that healthy group, and the span between those two points, the central 95% of values, becomes the published range. The Merck Manual's professional guidance for laboratories recommends at least 120 reference individuals to establish a range, and notes that while a reference range does not allow a perfect split between health and disease, it is built to represent roughly 95% of an otherwise healthy population.
That middle 95% becomes the two numbers on your report. The 5% left over, split evenly above and below, becomes "abnormal" by definition, not by any direct observation of your own health. Testing.com's patient-facing explainer makes the dependency explicit: the most important step in building a reference range is defining the reference population it represents, which may be chosen by age, sex, race, or general health history. A different reference population produces a different line, which is also why the same blood draw can carry two different "normal" ranges depending on which laboratory processes it: each lab validates its own ranges, so results can vary from one facility to the next even when nothing about the patient has changed.
The math quietly works against you
Here is the part the two numbers in parentheses never explain. Because the range is built to contain 95% of a healthy population, 5% of genuinely healthy people will always land outside it on any single test, simply from the shape of the statistics. A peer-reviewed review of exactly this problem, published in the Journal of the American Board of Family Medicine and indexed on the NCBI Bookshelf, spells out what happens once you stop testing one marker at a time: as a corollary of the central 95% convention, if twenty tests are run on a healthy person, one result is expected to fall outside its reference range purely by chance. Carried across a full panel, the odds of a healthy person clearing all twenty tests without a single flag are about 36%, meaning roughly 64% of healthy people will have at least one "abnormal" result somewhere on a twenty-marker panel.
That is not a flaw in your blood. It is a built-in property of how the line was drawn. A single flagged value sitting on a page otherwise full of in-range numbers is far more often that statistical certainty catching up with you than a sign that something has quietly gone wrong.
Two different kinds of "normal"
Not every number on a lab report is built the way ferritin, hemoglobin, or a hormone level is built. Some of the most familiar cutoffs in medicine were never drawn from a healthy population's bell curve at all. Cholesterol is the clearest example of the other method. A standard statistical range calculated from the general population would place the upper boundary around 280 to 300 mg/dL, since that is where the top 2.5% of the population begins. Instead, the cutoffs most clinicians use flag total cholesterol above 200 mg/dL as borderline and above 240 mg/dL as high, thresholds chosen because large outcomes studies showed cardiovascular risk climbing meaningfully at those much lower levels. Blood sugar follows the same logic: its thresholds were drawn from research tracking who went on to develop disease, not from a healthy-population percentile.
So a report can hand you two kinds of line that look identical in format. One describes a crowd. The other describes a risk threshold built from tracking real outcomes over time. Knowing which kind sits beside a given number changes how much weight a result near the edge deserves.
When "normal" and "optimal" are not the same claim
Ferritin is a useful case study because it shows both problems at once: a range built the ordinary statistical way, and a growing body of outcomes research suggesting it sits lower than it should. A 2012 randomized controlled trial published in CMAJ enrolled non-anemic, menstruating women reporting unexplained fatigue, all with ferritin below 50 micrograms per liter, a level comfortably inside most laboratories' published "normal" range. After twelve weeks of oral iron, the trial supported considering supplementation for women with unexplained fatigue whose ferritin sits below that 50 µg/L mark. An earlier 2003 trial published in BMJ reached a similar conclusion in a comparable population of fatigued, non-anemic women.
The American Society of Hematology's 2023 education program went further, arguing the range itself deserves reconsideration. Its authors note that studies have found 30 to 50% of healthy women have no detectable marrow iron stores at all, which means basing a ferritin cutoff on the lowest 2.5% of a sampled female population is not a sound method to begin with, and several lines of evidence instead point to a physiologic cutoff closer to 50 ng/mL. A statistically ordinary 95% range can still sit well below the level where a meaningful share of people start to feel and function differently. "Normal" and "optimal" are two separate claims, built by two different processes, and a lab report rarely tells you which one you are reading.
How to actually read your own panel
None of this makes a reference range useless. It makes it a starting prompt rather than a finish line. Read a result against its own history, ideally from the same lab each time, since methodology differences alone can shift where the line sits. Ask whether a number looks like a statistical range describing a crowd or a decision limit built from outcomes data, because the two deserve different amounts of concern near the edge. Treat a single flagged value on an otherwise clean panel as a prompt to look closer, not an alarm, given how often that flag is simply the one-in-twenty math at work. And when a result sits comfortably "in range" while symptoms persist, treat that as information worth bringing to a clinician rather than a dead end, the same way the ferritin research above came from researchers who kept asking questions after the word "normal" had already been printed on the page.
Common questions
If a result comes back flagged, does that automatically mean something is wrong? Not on its own. A flag means a value fell outside the central 95% of a reference population, which by design happens to roughly 1 in 20 healthy people on any given test, and to a majority of healthy people somewhere across a full twenty-marker panel. A flagged value is a prompt to look at context, trend, and symptoms, not a diagnosis by itself.
Why do two labs give different reference ranges for the exact same test? Because each lab recruits its own reference population and runs its own instruments and assay methods, and both choices shift where the central 95% falls. Tracking a value over time is most reliable when you stay with the same lab rather than comparing results from different facilities.
Is there a universal "optimal" range I should look for instead of the standard one? Not for most tests. A handful of markers, like cholesterol and blood sugar, have decision limits built from large outcomes studies. Most routine lab markers lack that same depth of outcomes research behind a specific "optimal" number, so a confident optimal figure deserves the same scrutiny as the standard range itself.
Should a "normal" result be ignored if symptoms persist? No. A reference range describes a healthy population in general; it was never built to settle an individual case on its own. A persistent symptom alongside an in-range result is worth raising with a clinician as a pattern worth investigating further, not a contradiction to dismiss.